JVM Architecture
- 11 mins
Note: Written in 2019. JVM architecture fundamentals remain valid, but modern JVMs (Java 17+) include significant improvements like ZGC, Shenandoah GC, and upcoming features like Project Leyden. Core concepts described here are still accurate.
Java source codes are compiled into an intermediate state called bytecode (i.e. .class file) using the Java compiler (javac). The Java Virtual Machine a.k.a JVM interprets the bytecode (without further recompilations) into native machine language. Therefore, bytecode acts as a platform-independent intermediary state which is portable among any JVM regardless of underlying OS and hardware architecture.
The JVM is a specification. Vendors are free to customize, innovate, and improve its performance during the implementation.

1. Class Loader Subsystem
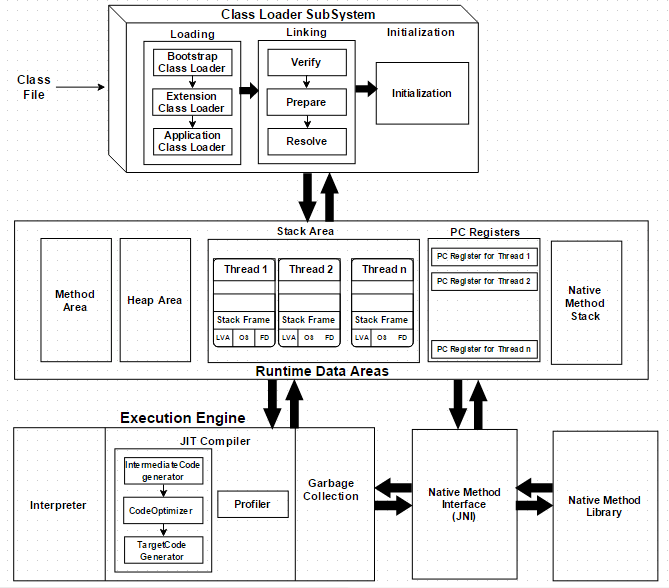
The JVM resides on the RAM. During execution, using the Class Loader subsystem, the class files are brought on to the RAM. This is called Java’s dynamic class loading functionality. It loads, links, and initializes the class file (.class) when it refers to a class for the first time at runtime (not compile time).
1.1. Loading
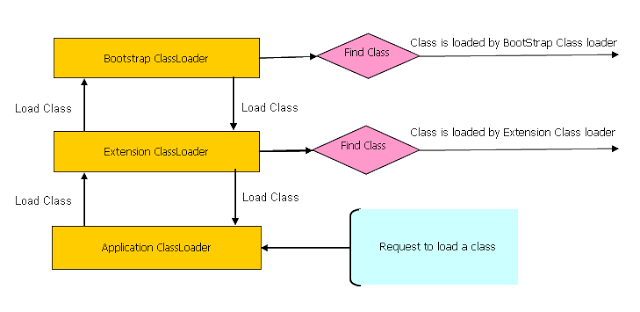
- Bootstrap Class Loader loads standard JDK classes such as core Java API classes (e.g.
java.lang.*package classes) from$JAVA_HOME/jre/rt.jar. The class loader acts as parent of all class loaders in Java; - Extension Class Loader delegates class loading request to its parent, Bootstrap and if unsuccessful, loads classes from the extensions directories (e.g. security extension functions) in extension path
$JAVA_HOME/jre/lib/extor any other directory specified by thejava.ext.dirssystem property; - System/Application Class Loader loads application specific classes from system class path, that can be set while invoking a program using
-cpor-classpathcommand line options.

Note: It is possible to directly create a User-defined Class Loader on the code itself.
1.2. Linking
Linking is to verify and prepare a loaded class or interface, its direct superclasses and superinterfaces, and its element type as necessary, while following the below properties:
- Verification: ensure the correctness of
.classfile, If verification fails, it throws runtime errors (java.lang.VerifyError). For instance, the following checks are performed:- consistent and correctly formatted symbol table;
- final methods / classes not overridden;
- methods respect access control keywords;
- methods have correct number and type of parameters;
- bytecode doesn’t manipulate stack incorrectly;
- variables are initialized before being read;
- variables are a value of the correct type.
- Preparation: allocate memory for static storage and any data structures used by the JVM such as method tables. Static fields are created and initialized to their default values, however, no initializers or code is executed at this stage;
- Resolution: replace symbolic references from the type with direct references. It is done by searching into method area to locate the referenced entity.
1.3. Initialization
The initialization logic of each loaded class or interface will be executed (e.g. calling the constructor of a class). Since JVM is multi-threaded, initialization of a class or interface should happen very carefully (i.e. make it thread safe).
2. Runtime Data Areas
Runtime Data Areas are the memory areas assigned when the JVM program runs on the OS.
In addition to reading .class files, the Class Loader subsystem generates corresponding binary data and save the following information in the Method area for each class separately:
- fully qualified class name (FQCN) of the loaded class and its immediate parent class;
- whether
.classfile is related to a Class, Interface or Enum; - modifiers, static variables, and method information etc.
For every loaded .class file, it creates exactly one Class object to represent the file in the Heap memory. This Class object can be used to read class level information (class name, parent name, methods, variable information, static variables etc.) later in the code.
2.1 Method Area (Shared)
This is a shared resource (only 1 method area per JVM). All JVM threads share this same method area, which means the access to the method data and the process of dynamic linking must be thread safe.
Method area stores class level data (including static variables) such as:
- ClassLoader reference;
- runtime constant pool;
- field data;
- method data;
- method code.
2.2 Heap Area (Shared)
This is also a shared resource (only 1 heap area per JVM). Information of all objects and their corresponding instance variables and arrays are stored in the Heap area. Heap area is a great target for GC.
2.3. Stack Area (Per thread)
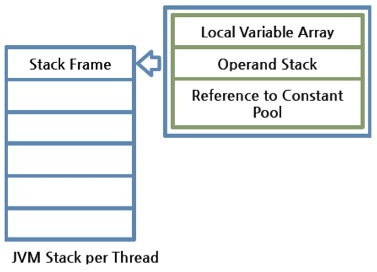
This is not a shared resource (thread safe). Every JVM thread has a separate runtime stack to store method calls. For every such method call, one entry will be created and added (pushed) into the top of runtime stack and such entry it is called a Stack Frame.

A Stack Frame is divided into three sub-entities:
- Local Variable Array: contains local variables and their values;
- Operand Stack: this acts as a runtime workspace to perform any intermediate operation. Each method exchanges data between the Operand stack and the local variable array, and pushes or pops other method invoke results;
- Frame Data: all symbols related to the method are stored here. For exceptions, the catch block information will also be maintained in the frame data.
The frame is removed (popped) when the method returns normally or if an uncaught exception is thrown during the method invocation. Since these are runtime stack frames, after a thread terminates, its stack frame will also be destroyed by JVM.
The stack frame is size fixed, however, the stack itself can be a dynamic or fixed size. If a thread requires a larger stack than allowed a StackOverflowError is thrown. If a thread requires a new frame and there isn’t enough memory to allocate it then an OutOfMemoryError is thrown.
2.4. PC Registers (Per thread)
For each JVM thread, when the thread starts, a separate PC (Program Counter) Register gets created in order to hold the address of currently-executing instruction (memory address in the method area). If the current method is native then the PC is undefined. Once the execution finishes, the PC register gets updated with the address of next instruction.
2.5. Native Method Stack (Per thread)
There is a direct mapping between a Java thread and a native operating system thread. After preparing all the state for a Java thread, a separate native stack also gets created in order to store native method information invoked through JNI (Java Native Interface).
Once the native thread has been created and initialized, it invokes the run() method in the Java thread. When the thread terminates, all resources for both the native and Java threads are released. The native thread is reclaimed once the Java thread terminates. The operating system is therefore responsible for scheduling all threads and dispatching them to any available CPU.
3. Execution Engine
Execution Engine executes the instructions in the bytecode line-by-line by reading the data assigned to Runtime Data Areas.
3.1. Interpreter
The interpreter interprets the bytecode and executes the instructions one-by-one. Hence, it can interpret one bytecode line quickly, but executing the interpreted result is a slower task. The disadvantage is that when one method is called multiple times, each time a new interpretation and a slower execution are required.
3.2. Just-In-Time (JIT) Compiler
The JIT compiler, compiles the bytecode to native code. Then for repeated method calls, it directly provides the native code.
However, even for JIT compiler, it takes more time for compiling than for the interpreter to interpret. For a code segment that executes just once, it is better to interpret it instead of compiling. Also the native code is stored in the cache, which is an expensive resource. With these circumstances, JIT compiler internally checks the frequency of each method call and decides to compile each only when the selected method has occurred more than a certain level of times. This idea of adaptive compiling has been used in Oracle Hotspot VMs.
Execution Engine qualifies to become a key subsystem when introducing performance optimizations by JVM vendors. Among such efforts, the following 4 components can largely improve its performance:
- Intermediate Code Generator produces intermediate code;
- Code Optimizer is responsible for optimizing the intermediate code generated;
- Target Code Generator is responsible for generating Native Code (i.e.Machine Code);
- Profiler is a special component, responsible for finding performance bottlenecks a.k.a.hotspots.
3.3. Garbage Collector
As long as an object is being referenced, the JVM considers it alive. Once an object is no longer referenced and therefore is not reachable by the application code, the garbage collector removes it and reclaims the unused memory.
4. Java Native Interface (JNI)
This interface is used to interact with Native Method Libraries. This enables JVM to call C/C++ libraries and to be called by C/C++ libraries which may be specific to hardware.
5. Native Method Libraries
This is a collection of C/C++ Native Libraries which is required for the Execution Engine and can be accessed through the provided Native Interface.
6. JVM Threads
The JVM concurrently runs multiple threads, some of these threads carry the programming logic and are created by the program (application threads), while the rest is created by JVM itself to undertake background tasks in the system (system threads).
The major application thread is the main thread which is created as part of invoking public static void main(String[]) and all other application threads are created by this main thread. Application threads perform tasks such as executing instructions starting with main() method, creating objects in Heap area if it finds new keyword in any method logic etc.
The major system threads are as follows:
- Compiler threads: At runtime, compilation of bytecode to native code is undertaken by these threads;
- GC threads: All the GC related activities are carried out by these threads;
- Periodic task thread: The timer events (i.e. interrupts) to schedule execution of periodic operations are performed by this thread;
- Signal dispatcher thread: This thread receives signals sent to the JVM process and handle them inside the JVM by calling the appropriate JVM methods;
- VM thread: This thread waits for operations to appear that require the JVM to reach a safe-point where modifications to the heap can not occur. The type of operations performed by this thread are “stop-the-world” garbage collections, thread stack dumps, thread suspension and biased locking revocation.
7. Conclusion
Java is considered as both compiled (high-level java code into bytecode) and interpreted (bytecode into native machine code). By design, Java is slow due to dynamic linking and run-time interpreting, however, JIT compiler compensate for the disadvantages of the interpreter for repeating operations by keeping a native code instead of bytecode.
8. Useful Commands
javac: Java compiler;javap: Dump.classdata;-XX:+PrintCompilation: Log every time a method is compiled to native code;-XX:+PrintInlining: Display a tree how methods has been inlined;-XX:+PrintAssembly: Look at the native code that JVM is outputting;jps: lists running Java processes;jcmd: used to send diagnostic command requests to the JVMjcmd(without any parameters): list all JVM processes;jcmd [PID] help: show available commands;jcmd [PID] GC.heap_dump [PATH]: heap dump;jcmd [PID] Thread.print: Thread dump.
